PM10, PM2.5 and Deposited Dust: Understanding Monitoring Results
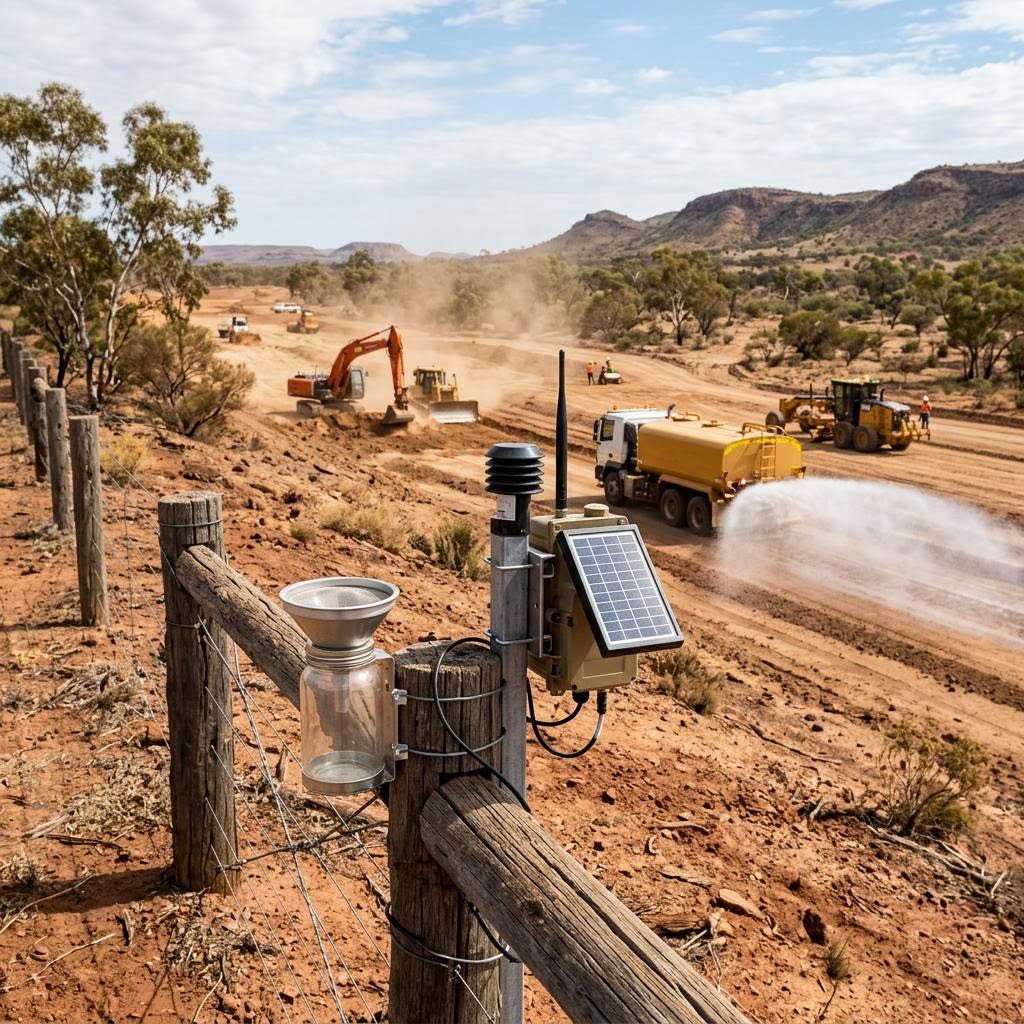
A dust monitoring report may contain real-time particulate graphs, daily summaries and deposited dust results. These are not interchangeable measures. Each describes a different aspect of air quality over a defined period and needs its own interpretation.
This guide helps project teams read the results and ask useful questions. Applicable criteria, methods and averaging periods depend on the monitoring purpose and project requirements. It does not provide a universal pass-or-fail threshold.
Identify what each measure represents
PM10 and PM2.5 describe size-selective fractions of airborne particulate matter, commonly associated with aerodynamic diameters of 10 and 2.5 micrometres respectively. Their reported concentrations represent particles suspended in air under the method used. They are overlapping fractions, not separate quantities to add together.
Deposited dust measures material settling over a collection period. In air quality and dust monitoring programmes, deposition and airborne particulate measurements may complement each other, but one cannot be substituted for the other or converted into it using a simple universal factor.
Read units and averaging periods before the graph
Airborne particulate results are often expressed as mass per volume of air, while deposition results describe mass settling over an area and time. Check the units printed in the actual report. A result in different units or over a different period cannot be compared directly with a criterion.
A short-duration rise may be operationally useful without being equivalent to a daily average. Conversely, a longer average can conceal a brief event worth investigating. Ask the practitioner to identify which summaries support assessment and which are management indicators.
- Measured fraction or deposition parameter.
- Units and averaging or collection period.
- Monitoring method and valid data coverage.
- Applicable project criterion and its matching period.
- Quality flags and interpretation limitations.
Use weather and activity records to interpret changes
Wind direction, wind speed, rainfall and surrounding activities can help explain a change in readings. Regional smoke, traffic or another site may influence particulate measurements. A high value alone does not identify its source, and a gauge result integrates conditions across its whole collection period.
For example, visible dust during a short haul-road event and an elevated daily particulate result may be related, but the relationship still needs evidence. Compare event times, local observations, instrument position and weather before assigning a contribution to a particular activity.
Keep general dust results separate from hazard-specific conclusions
General particulate or deposition monitoring does not identify every constituent in the material measured. It should not be presented as an asbestos clearance result or as proof that other hazardous dust exposures have been assessed. Hazard-specific questions require an appropriate separate scope and method.
When reviewing a report, ask what the data supports, what remains uncertain and whether an investigation or control response is needed under the project plan. Retain the underlying time series and event notes so later questions can be addressed without relying on a summary chart alone.
Key takeaways
- PM fractions and deposition describe different measures.
- Do not add PM10 and PM2.5 as independent totals.
- Match units and periods before comparing results.
- Use weather and activity evidence for attribution.
- General dust data does not establish hazard-specific clearance.
Frequently asked questions
- Can deposited dust be converted to PM10?
- Not through a universal conversion. The measures describe different physical quantities and periods, so their relationship depends on the setting and methods.
- Does a particulate peak prove the site caused dust?
- No. Source interpretation needs supporting evidence such as weather, location, activity records and other relevant observations.
- Does a general dust monitor detect asbestos?
- General particulate monitoring does not provide asbestos identification or clearance. Hazard-specific assessment needs an appropriate professional scope and method.
Understand what your dust data supports
Share your monitoring purpose and existing results to discuss an appropriate air quality programme and interpretation.
Related services
- Air Quality Monitoring — Dust, emissions, and ambient air monitoring for construction and industry.
Keep reading
- Baseline Air Monitoring: Accounting for Weather and Nearby Activities — A baseline describes observed conditions and their context, not a fixed background number for every future day.
- Dust Monitoring on Construction and Demolition Sites — Dust is a leading cause of complaints and regulator attention on building sites. Here is how monitoring works and how to keep it under control.